I am having problem understanding where to link the two pink boxes on the calculations sheet for the circular dial widget. Is there video on this. I have all the rest linked. Thanks,
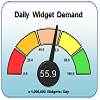
The pink boxes are used to feed the donut graph that makes up the main part of the circular dial widget.
The two values in the pink boxes add together to make the complete donut (i.e. 360 degrees) - i.e. if you had "3" and "9" your donut would show 1/4 of an arc.
There is a video which shows how to link the existing donut graph to the boxes here (skip forward to 20 minutes and 12 seconds for the configuration). We should add that this is an earlier version of the circular dial where the pink boxes are actually blue (and labelled "x" and "y" in the video) - but the process is the same.
If this video isn't clear, we can make another version which takes more time and detail concerning how to link the dial to the pink boxes.